Graph
The graph view turns your archive into a living map. Every file is a node, and the connections between them show similarity relationships based on their embeddings.
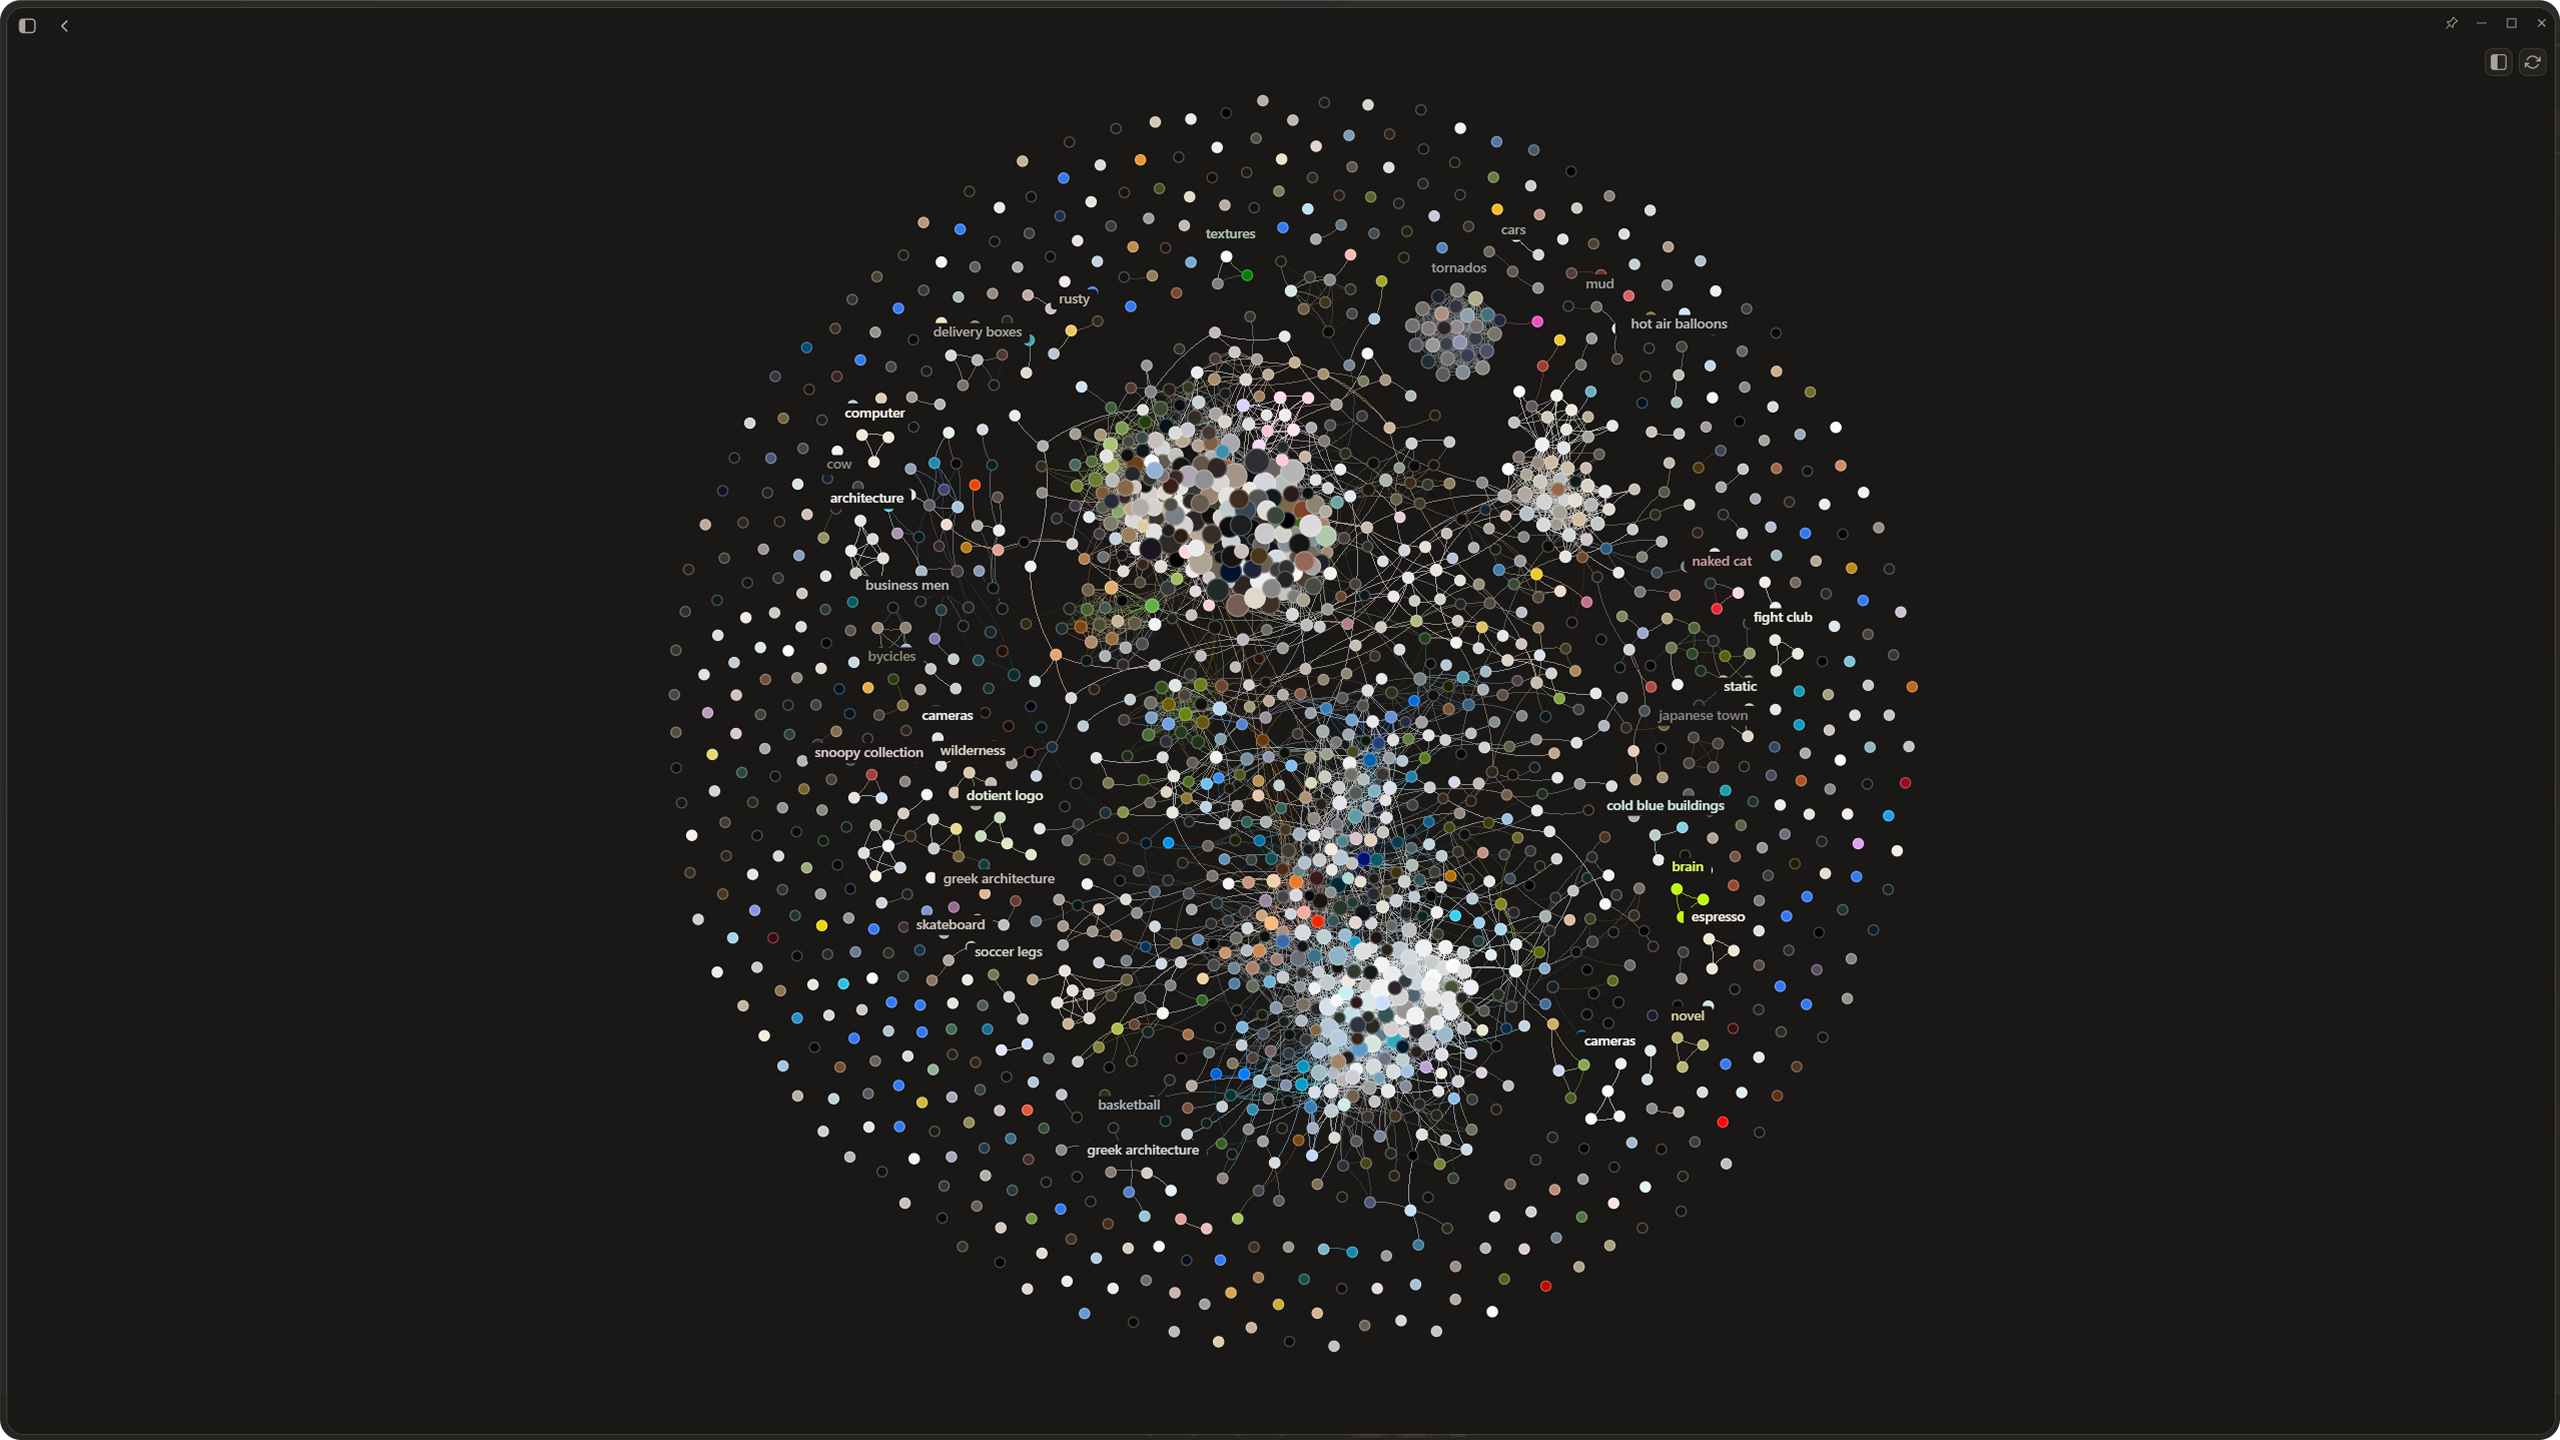
Opening the Graph
Click "Graph View" in the sidebar to open the similarity graph. This is a full page view that renders a force directed layout where related files cluster together naturally.
The simulation uses Barnes-Hut approximation for performance, which means it can handle large archives without slowing down. When the simulation settles (55 consecutive frames below a velocity threshold), it goes to sleep to save resources. Any interaction wakes it back up.
Navigating the Graph
You can pan by clicking and dragging on the background. Scroll to zoom in and out. Hover over any node to see a tooltip with the file name and similarity information. The tooltip is debounced at 100ms so it does not flicker when you move across many nodes quickly.
Click a node to select it. You will be sent to the detailed file view page, the same place you would be sent if you clicked on an item in the gallery view.
The graph is theme aware, so node and edge colors adjust when you switch between light and dark mode.
Edge Rendering
The edges between nodes are rendered as cubic Bezier curves using WebGL. This is much more performant than canvas or SVG for large graphs. The edge colors gradient between the two connected nodes. The GPU buffer is rebuilt whenever the graph structure changes, like after importing new files.
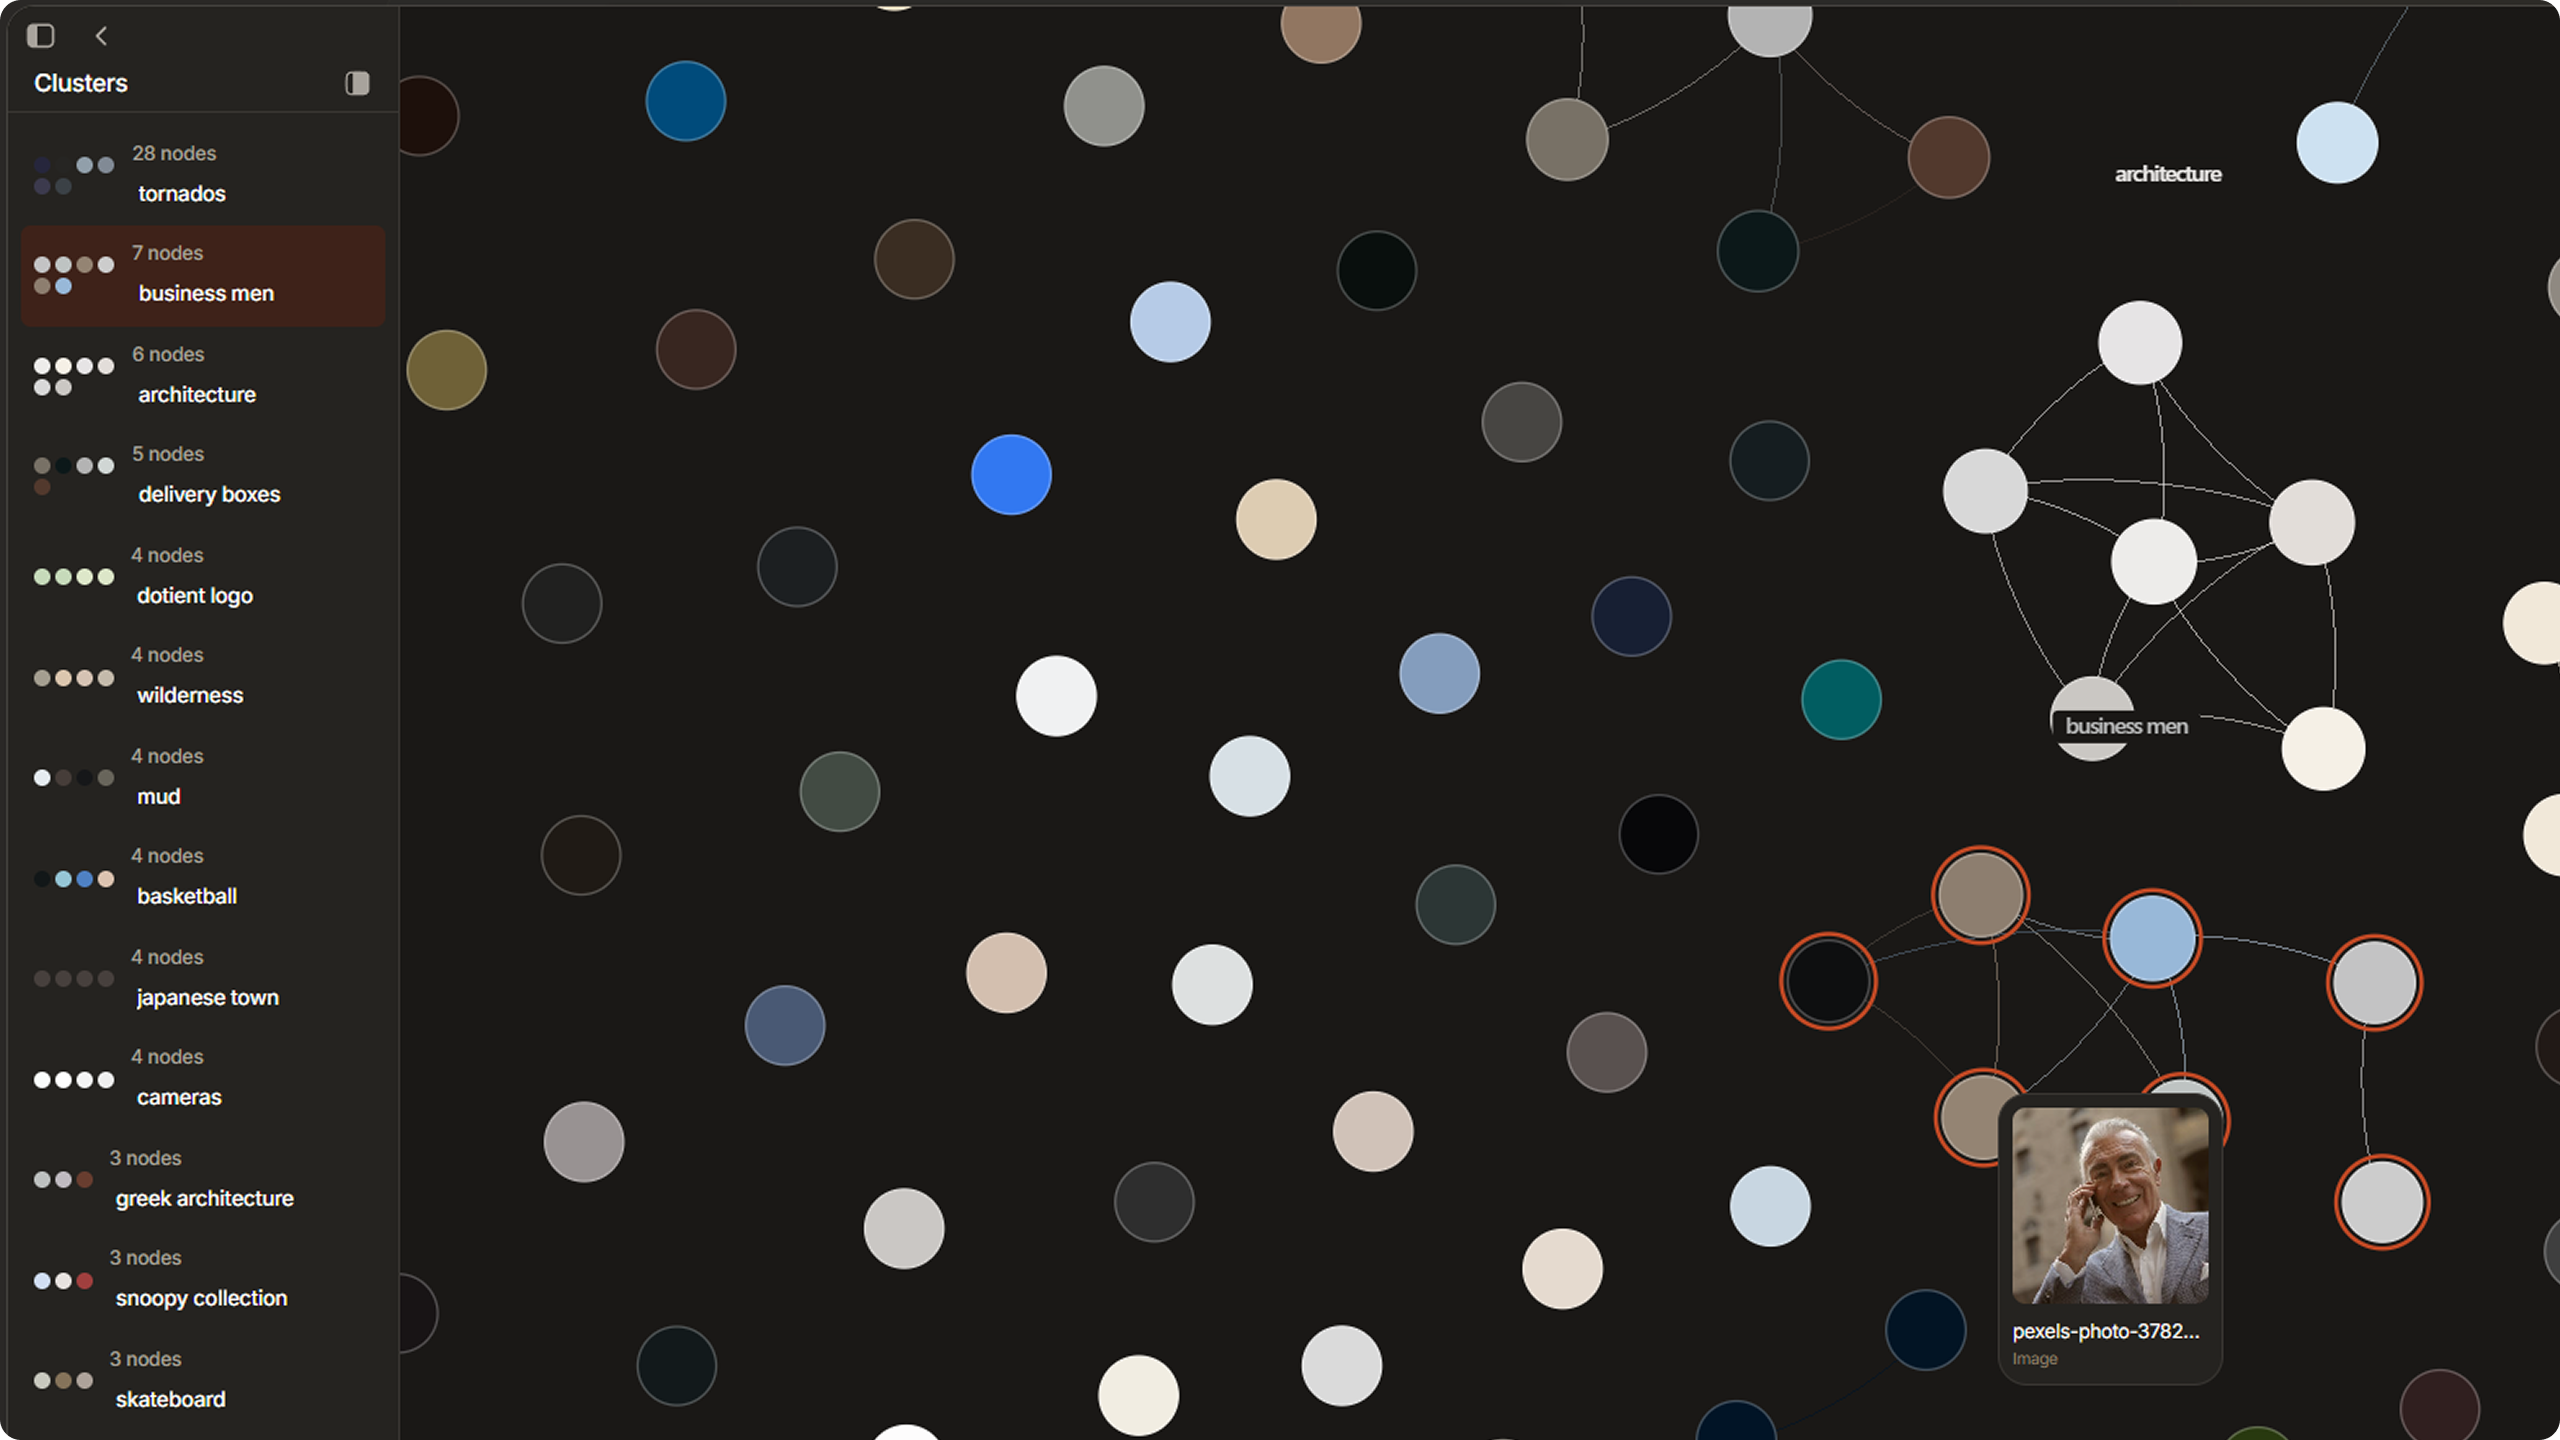
Clusters
The sidebar in the graph view shows detected clusters. These are groups of files that are more similar to each other than to the rest of the archive. Each cluster is color coded. Hover over a cluster name to highlight its nodes in the graph. This is a great way to find unexpected groupings in your archive.
Clusters are detected via a backend API, so they are computed based on the actual embeddings rather than just visual similarity.